Exoplanet Explorer
Table of Contents
Question
If the universe speaks in light, can we learn its language well enough to find new worlds?
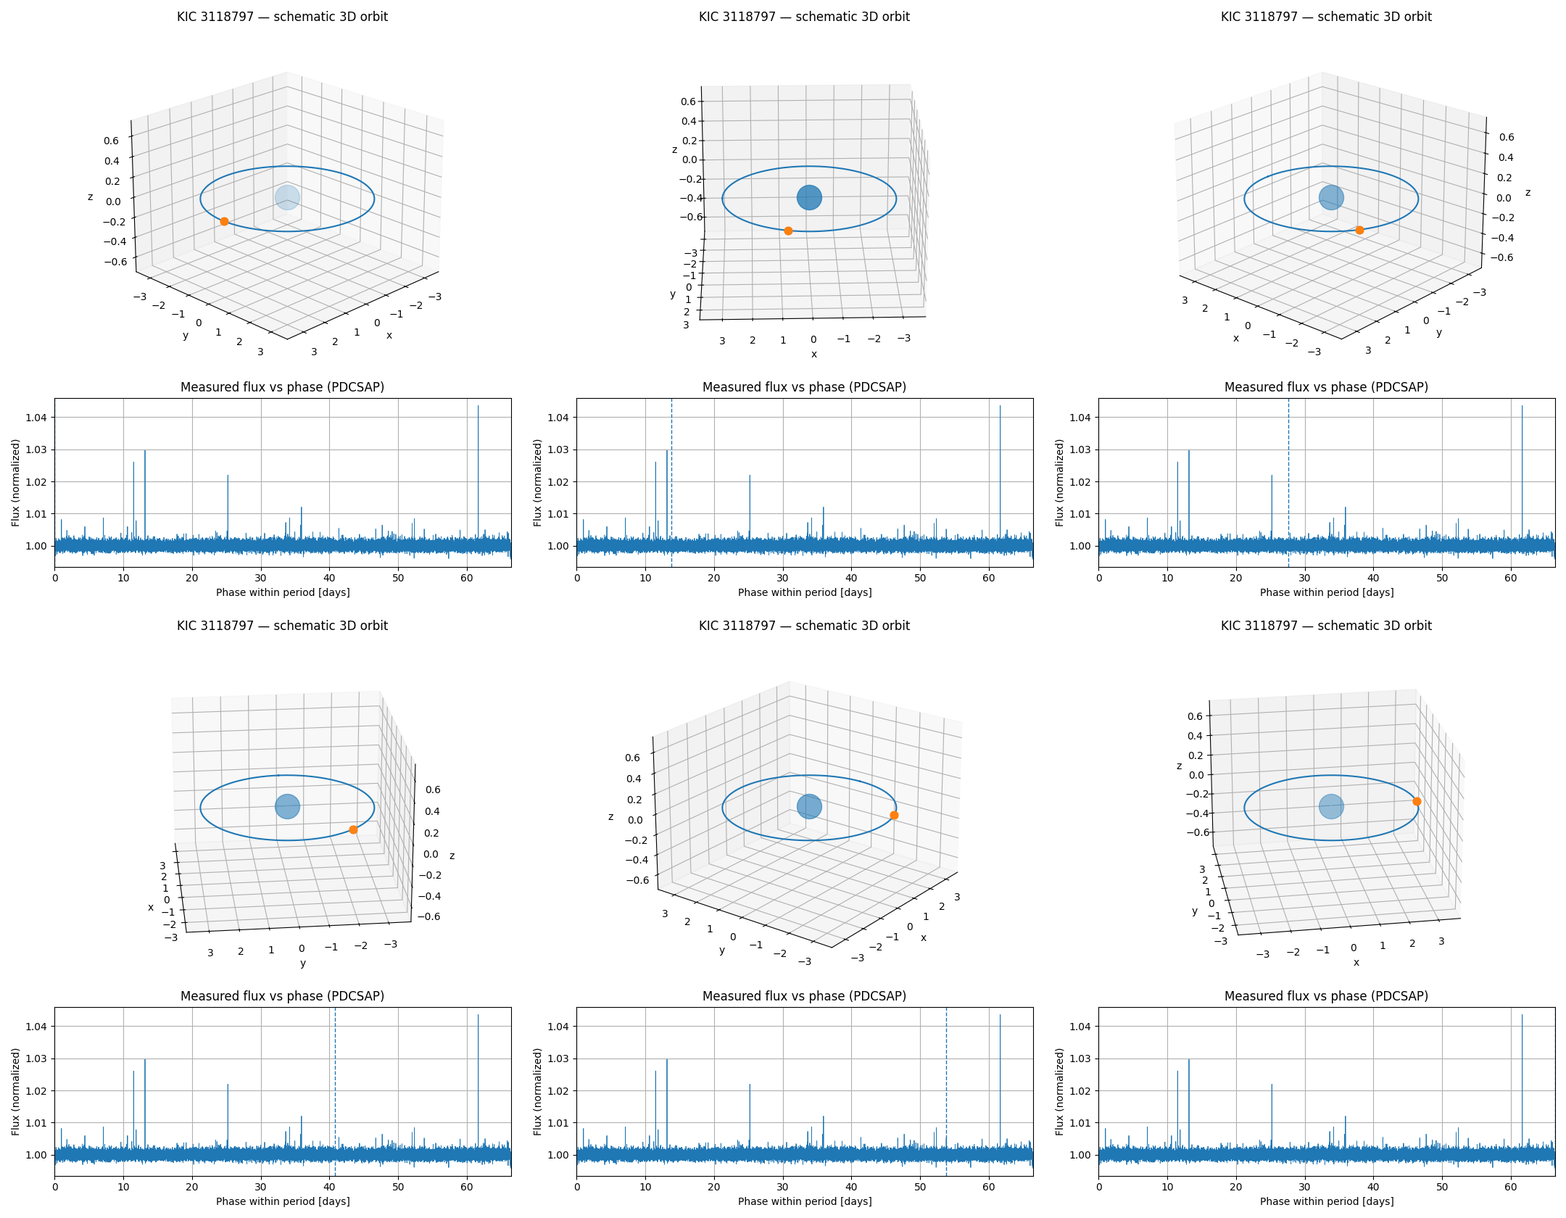
The visual above shows the transit method, a technique used to detect exoplanets. Planets that orbit stars outside our solar system. It detects exoplanets by observing slight, regular dips in a star’s light as a planet passes in front. Thousands of exoplanets have been discovered, with some estimates suggesting there could be at least one planet for every star in the galaxy. Our galaxy alone has 100 to 400 billion stars, and with at least one planet per star, that’s roughly the same number of exoplanets. Mind blowing. To put that in perspective, if you counted one exoplanet every second, non-stop, it would take you somewhere between 3,200 and 12,700 years to finish.

On October 4–5, I took part in the NASA Space Apps Challenge. It’s a global hackathon where participants leverage NASA’s open data to develop solutions for challenges on Earth and beyond. I stepped into the event with no experience in space data, met my teammates that morning, and jumped in relying entirely on curiosity. We teamed up to take on the “A World Away: Hunting for Exoplanets with AI” challenge. Focused on using machine learning to identify planets orbiting distant stars. We created Exoplanet Explorer, an interactive web app that lets users explore model performance and 3D exoplanet visualizations. We’re also developing an upload feature that allows researchers to submit their own exoplanet data and run it through our models to classify planets as candidates or confirmed exoplanets. I was drawn to this challenge because it pushed my limits and connected AI to the enduring question of whether we’re alone in the universe.
Data
The data came from NASA’s exoplanet datasets: KOI (Kepler Object of Interest) and TESS (Transiting Exoplanet Survey Satellite). Each dataset provides rich detail about planetary candidates and their stars, including stellar metrics (temperature, luminosity, radius) and orbital features (period, planet radius, semi-major axis). We built a third, unified dataset to combine the two, allowing us to train the same models on KOI, TESS, and the merged dataset. In total, KOI contains 4,619 records (1,874 candidates; 2,745 confirmed), TESS contains 4,669 records (4,045 candidates; 624 confirmed), and the combined dataset includes 9,308 entries. Additional data features include the Lightkurve API data to recreate the transit method in a visualization.
Algorithm
We based our modeling approach on two research papers centered on astronomical machine learning. Malik et al. (2022) found that a LightGBM model could spot exoplanets almost as accurately as advanced deep-learning systems, but with far less computing power. It reached about 0.95 AUC on Kepler data and 0.98 on TESS. Luz et al. (2024) found that combining several models into one “stacked” ensemble gave better results on the KOI dataset than using any single model on its own. Using these insights, we created a stacked system. The first layer used four models (GradientBoost, XGBoost, AdaBoost, and RandomForest) and the second layer used LightGBM to merge their predictions into a single, more accurate result.
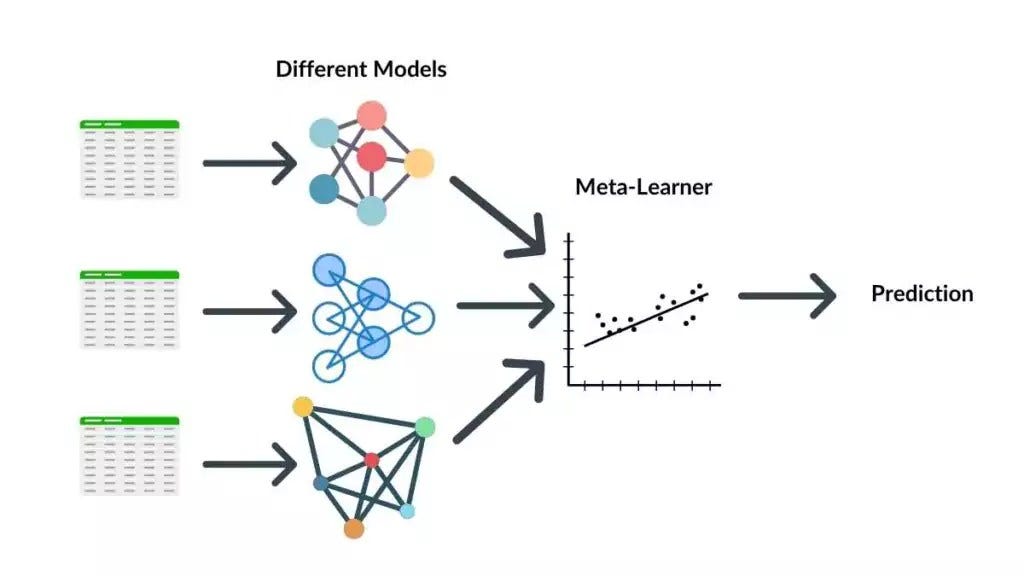
We trained each model on three versions of the data (KOI, TESS, and KOI+TESS) which gave us 15 different classifiers, each tuned to its own dataset. The ensemble handles complex patterns but stays efficient and explainable, giving us a clear way to turn faint starlight variations into strong signals of possible exoplanets.
Compute
All experiments for Exoplanet Explorer were run locally in a Jupyter Notebook inside VS Code, using a normal laptop with only a CPU. Because the KOI and TESS datasets are fairly small, this simple setup was more than enough for training, validating, and visualizing the models without running into performance issues. We trained the models in Python with scikit-learn. We originally planned to deploy a saved model (.pkl) so users could upload data and get instant predictions, but we couldn’t finish it before the deadline. Instead of live predictions, the site currently displays model predictions from the training set for roughly 30 exoplanets per dataset.
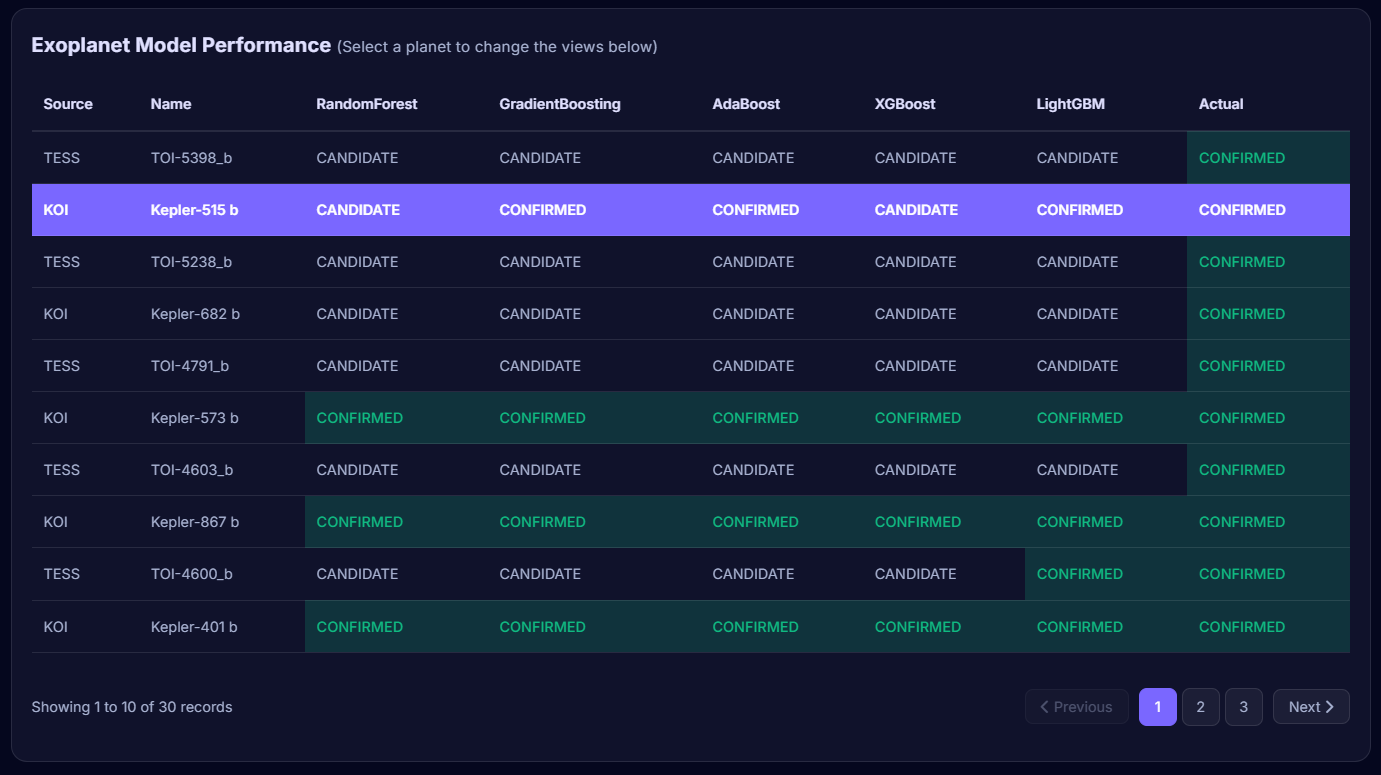
You can see each exoplanet’s name, ID, the five model scores, and the actual label. It keeps things transparent and easy to interpret, showing each model’s vote without needing heavy computation.
Evaluation
To evaluate model performance we used AUC as the main measure, plus accuracy, precision, recall, and F1. Every experiment used a 70/15/15 split for training, validation, and testing across five models: GradientBoosting, RandomForest, AdaBoost, XGBoost, and a LightGBM ensemble. The KOI results were consistent, and GradientBoosting came out on top with an AUC of 0.76, meaning it could separate candidates from confirmed planets fairly well. TESS was noisier, leading to a lower AUC of about 0.62. When we merged KOI and TESS, performance improved sharply. RandomForest and XGBoost reached about 0.84 AUC. Combining data from two missions gave the models more variety to learn from, helping them generalize better. The LightGBM ensemble scored 0.78 AUC but didn’t top the best individual models, likely due to shared errors across the base learners. Overall, the results confirmed that boosted tree models are strong performers for finding exoplanets. Most importantly, they showed that combining signals helps us understand more.
Deployment
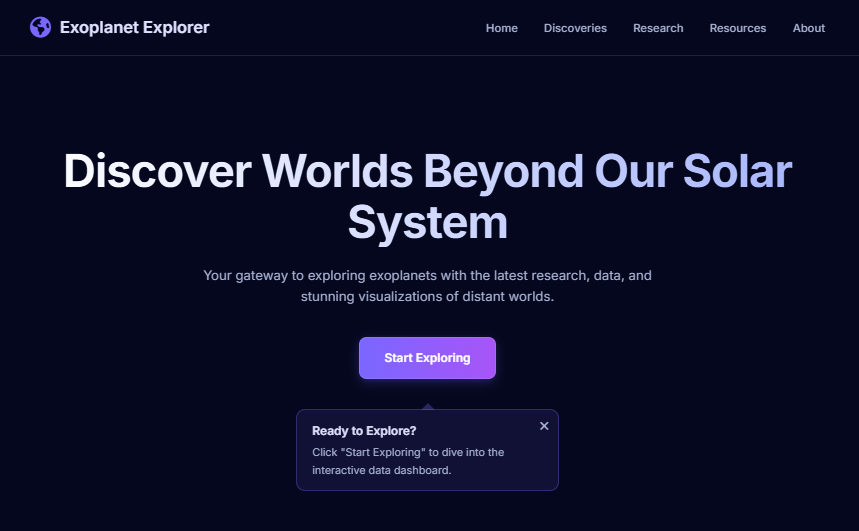
The original idea for Exoplanet Explorer was to let users upload their own data and get real-time predictions from our models. It evolved into something more engaging: a visual, educational way for people to explore the data and the model’s results. The site now offers an interactive dashboard where users pick a dataset and explore precomputed results through visualizations. When a dataset is selected, users see comparison metrics, a 3D t-SNE embedding of how the planets group together, and a table listing each exoplanet along with the outputs from all five models. The site also features NASA’s Exoplanet Visualization Tool, letting users watch each planet orbit its star in 3D, compare it to Earth, and explore its path like a mini–solar system. Additional panels show light-curve animations that reveal the tiny dip in a star’s brightness when a planet passes in front. Together, these features turn the project into an interactive, accessible way to learn how we detect exoplanets and read the universe’s light. If you want to explore it yourself, here’s the live Exoplanet Explorer. Just note that it might take 1–2 minutes to render because it’s hosted on a free tier.
Conclusion
In the end, I learned a lot from this experience. The project didn’t end exactly as we planned or fully finished, but we still built something real, and I picked up some great skills and insights about space data. I met some interesting people along the way as well. I’ve always been interested in space, but I thought exploration was only for experts or people already in the field. I was surprised to discover how much satellite data is openly available. A huge world of information for anyone who wants to explore.
References
- NASA Space Apps Challenge - A World Away: Hunting for Exoplanets with AI
- Exoplanets – planets orbiting stars beyond our solar system
- Transit Method – detecting planets by measuring dips in starlight
- Kepler Objects of Interest (KOI) – Kepler mission’s catalogue of exoplanet candidates
- TESS Objects of Interest (TOI) – TESS mission’s list of planetary candidates
- LightKurve API – Python library for accessing and analyzing NASA light curves
- Exoplanet Detection Using Machine Learning – ML techniques for identifying exoplanet candidates
- Assessment of Ensemble-Based Machine Learning Algorithms for Exoplanet Identification – study comparing ensemble models for detection
- Github – NASA Space Apps Github repository
- Exoplanet Explorer – interactive tool for visualizing exoplanet datasets and model results